Browser API FAQs
Find answers to common questions about Bright Data’s Browser API, including supported languages, debugging tips, and integration guidelines.
How do I configure Browser API to work from a specific country?
How do I configure Browser API to work from a specific country?
-country flag, after your USER credentials within the Bright Data endpoint, followed by the 2-letter ISO code for that country.For example, Browser API using Puppeteer in the USA:Which programming languages, libraries, and browser automation tools are supported by Browser API?
Which programming languages, libraries, and browser automation tools are supported by Browser API?
| Language/Platform | puppeteer | playwright | selenium |
|---|---|---|---|
| Python | N/A | *playwright-python | *Selenium WebDriver |
| JS / Node | *Native | *Native | *WebDriverJS |
| Java | Puppeteer Java | Playwright for Java | *Native |
| Ruby | Puppeteer-Ruby | playwright-ruby-client | Selenium WebDriver for Ruby |
| C# | *.NET: Puppeteer Sharp | Playwright for .NET | *Selenium WebDriver for .NET |
| Go | chromedp | playwright-go | Selenium WebDriver for Go |
| *Full support |
How can I debug what's happening behind the scenes during my Browser API session?
How can I debug what's happening behind the scenes during my Browser API session?
Where do I find the Browser API Debugger?
Where do I find the Browser API Debugger?
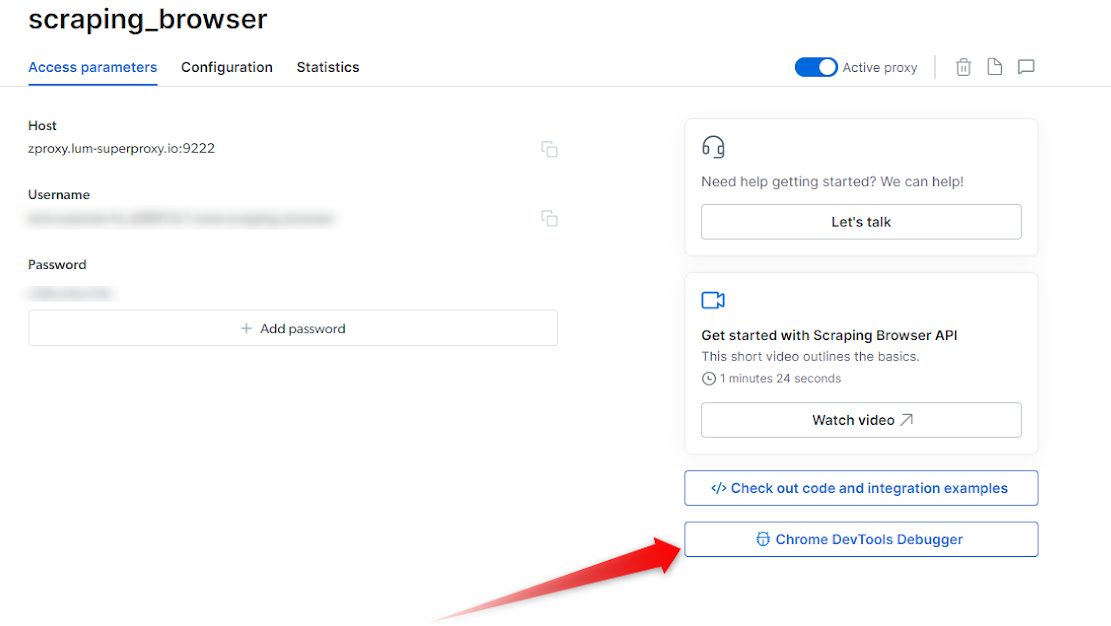
- Within the control panel, go to My Proxies view
- Click on your Browser API proxy
- Click on the Overview tab
-
On the right side, Click on the “Chrome Dev Tools Debugger” button
Open a Browser API Session
- Ensure you have an active Browser API session
- If you don’t yet know how to launch a Browser API session, see our Quick Start guide.
Launch the Debugger
- Once your session is up and running you can now launch the Debugger.
- Click on the Debugger button within your Overview tab to launch the Browser API Debugger interface (see the screenshot above )
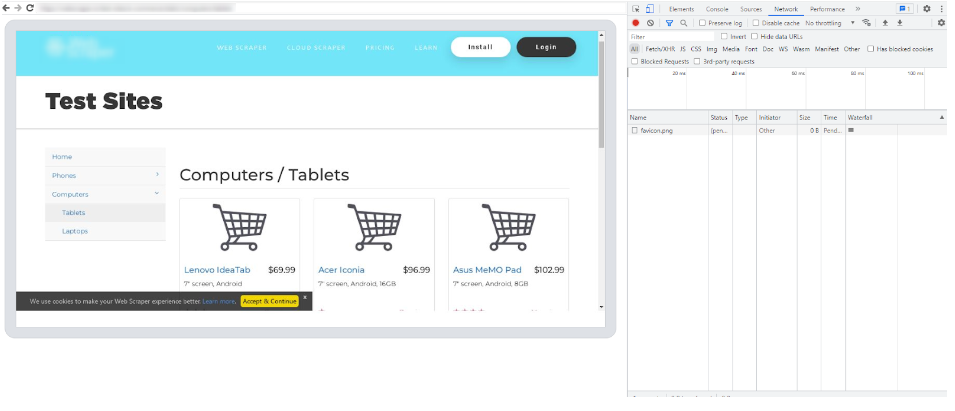
Connect with your live browser sessions
- Within the Debugger interface, you will find a list of your live Browser API sessions.
- Select the preferred session that you wish to debug
- Click on the session link or copy/paste it into your browser of choice, and this will establish a connection between the Debugger and your selected session.
- With the Browser API Debugger now connected to your live session, you gain access to the powerful features of Chrome Dev Tools.
- Utilize the Dev Tools interface to inspect HTML elements, analyze network requests, debug JavaScript code, and monitor performance. Leverage breakpoints, console logging, and other debugging techniques to identify and resolve issues within your code.
How to automatically launch devtools locally to view your live browser session?
How to automatically launch devtools locally to view your live browser session?
How can I see a visual of what's happening in the browser?
How can I see a visual of what's happening in the browser?
Why does the initial navigation for certain pages take longer than others?
Why does the initial navigation for certain pages take longer than others?
What are the most Common Error codes?
What are the most Common Error codes?
| Error Code | Meaning | What can you do about it? |
| Unexpected server response: 407 | An issue with the remote browser’s port | Please check your remote browser’s port. The correct port for Browser API is port:9222 |
| Unexpected server response: 403 | Authentication Error | Check authentication credentials (username, password) and check that you are using the correct “Browser API” zone from Bright Data control panel |
| Unexpected server response: 503 | Service Unavailable | We are likely scaling browsers right now to meet demand. Try to reconnect in 1 minute. |
I can't seem to establish a connection with Browser API, do I have a connection issue?
I can't seem to establish a connection with Browser API, do I have a connection issue?
If a JSON is returned within the response:
- Your authentication and connection to Browser API are successful. Confirm you are using these exact configurations in your script.
- If you are still facing issues connecting to Browser API, contact support for further assistance.
If a JSON is not returned within the response:
- Check your authentication details from your Browser API zone, and ensure the USER and PASS values are correct.
-
Verify network Configuration: Confirm your network and/or firewall is not blocking outbound connections to
https://brd.superproxy.io:9222. - If the issue persists, please contact support for further assistance.
How to Integrate Browser API with .NET Puppeteer Sharp?
How to Integrate Browser API with .NET Puppeteer Sharp?
Which coding languages does Browser API support?
Which coding languages does Browser API support?
| Language/Platform | puppeteer | playwright | selenium |
|---|---|---|---|
| Python | N/A | playwright-python | Selenium WebDriver |
| JS / Node | Native support | Native support | WebDriverJS |
| Java | Puppeteer Java | Playwright for Java | Native support |
| Ruby | Puppeteer-Ruby | playwright-ruby-client | Selenium WebDriver for Ruby |
| C# | .NET: Puppeteer Sharp | Playwright for .NET | Selenium WebDriver for .NET |
| Go | chromedp | playwright-go | Selenium WebDriver for Go |
How can I debug what's happening behind the scenes during my Browser API session?
How can I debug what's happening behind the scenes during my Browser API session?
Where do I find the Browser API Debugger?
Where do I find the Browser API Debugger?
- Within the control panel, go to My Proxies view
- Click on your Browser API proxy
- Click on the Overview tab
-
On the right side, Click on the “Chrome Dev Tools Debugger” button
Open a Browser API Session
- Ensure you have an active Browser API session
- If you don’t yet know how to launch a Browser API session, see our Quick Start guide.
Launch the Debugger
- Once your session is up and running you can now launch the Debugger.
- Click on the Debugger button within your Overview tab to launch the Browser API Debugger interface (see the screenshot above )
Connect with your live browser sessions
- Within the Debugger interface, you will find a list of your live Browser API sessions.
- Select the preferred session that you wish to debug
- Click on the session link or copy/paste it into your browser of choice, and this will establish a connection between the Debugger and your selected session.
- With the Browser API Debugger now connected to your live session, you gain access to the powerful features of Chrome Dev Tools.
- Utilize the Dev Tools interface to inspect HTML elements, analyze network requests, debug JavaScript code, and monitor performance. Leverage breakpoints, console logging, and other debugging techniques to identify and resolve issues within your code.
How to automatically launch devtools locally to view your live browser session?
How to automatically launch devtools locally to view your live browser session?
How can I see a visual of what's happening in the browser?
How can I see a visual of what's happening in the browser?
Why does the initial navigation for certain pages take longer than others?
Why does the initial navigation for certain pages take longer than others?
What are the most Common Error codes?
What are the most Common Error codes?
| Error Code | Meaning | What can you do about it? |
| Unexpected server response: 407 | An issue with the remote browser’s port | Please check your remote browser’s port. The correct port for Browser API is port:9222 |
| Unexpected server response: 403 | Authentication Error | Check authentication credentials (username, password) and check that you are using the correct “Browser API” zone from Bright Data control panel |
| Unexpected server response: 503 | Service Unavailable | We are likely scaling browsers right now to meet demand. Try to reconnect in 1 minute. |
How to Integrate Browser API with .NET Puppeteer Sharp?
How to Integrate Browser API with .NET Puppeteer Sharp?
Can I choose the country that the Browser API will scrape from?
Can I choose the country that the Browser API will scrape from?
const SBR_WS_ENDPOINT = 'wss://brd-customer-<customer_id>-zone-<zone_name>-country-us:<password>@brd.superproxy.io:9222'How does the Browser API pricing work?
How does the Browser API pricing work?
Is password typing allowed with Browser API?
Is password typing allowed with Browser API?